How to interpret the Quantifier output
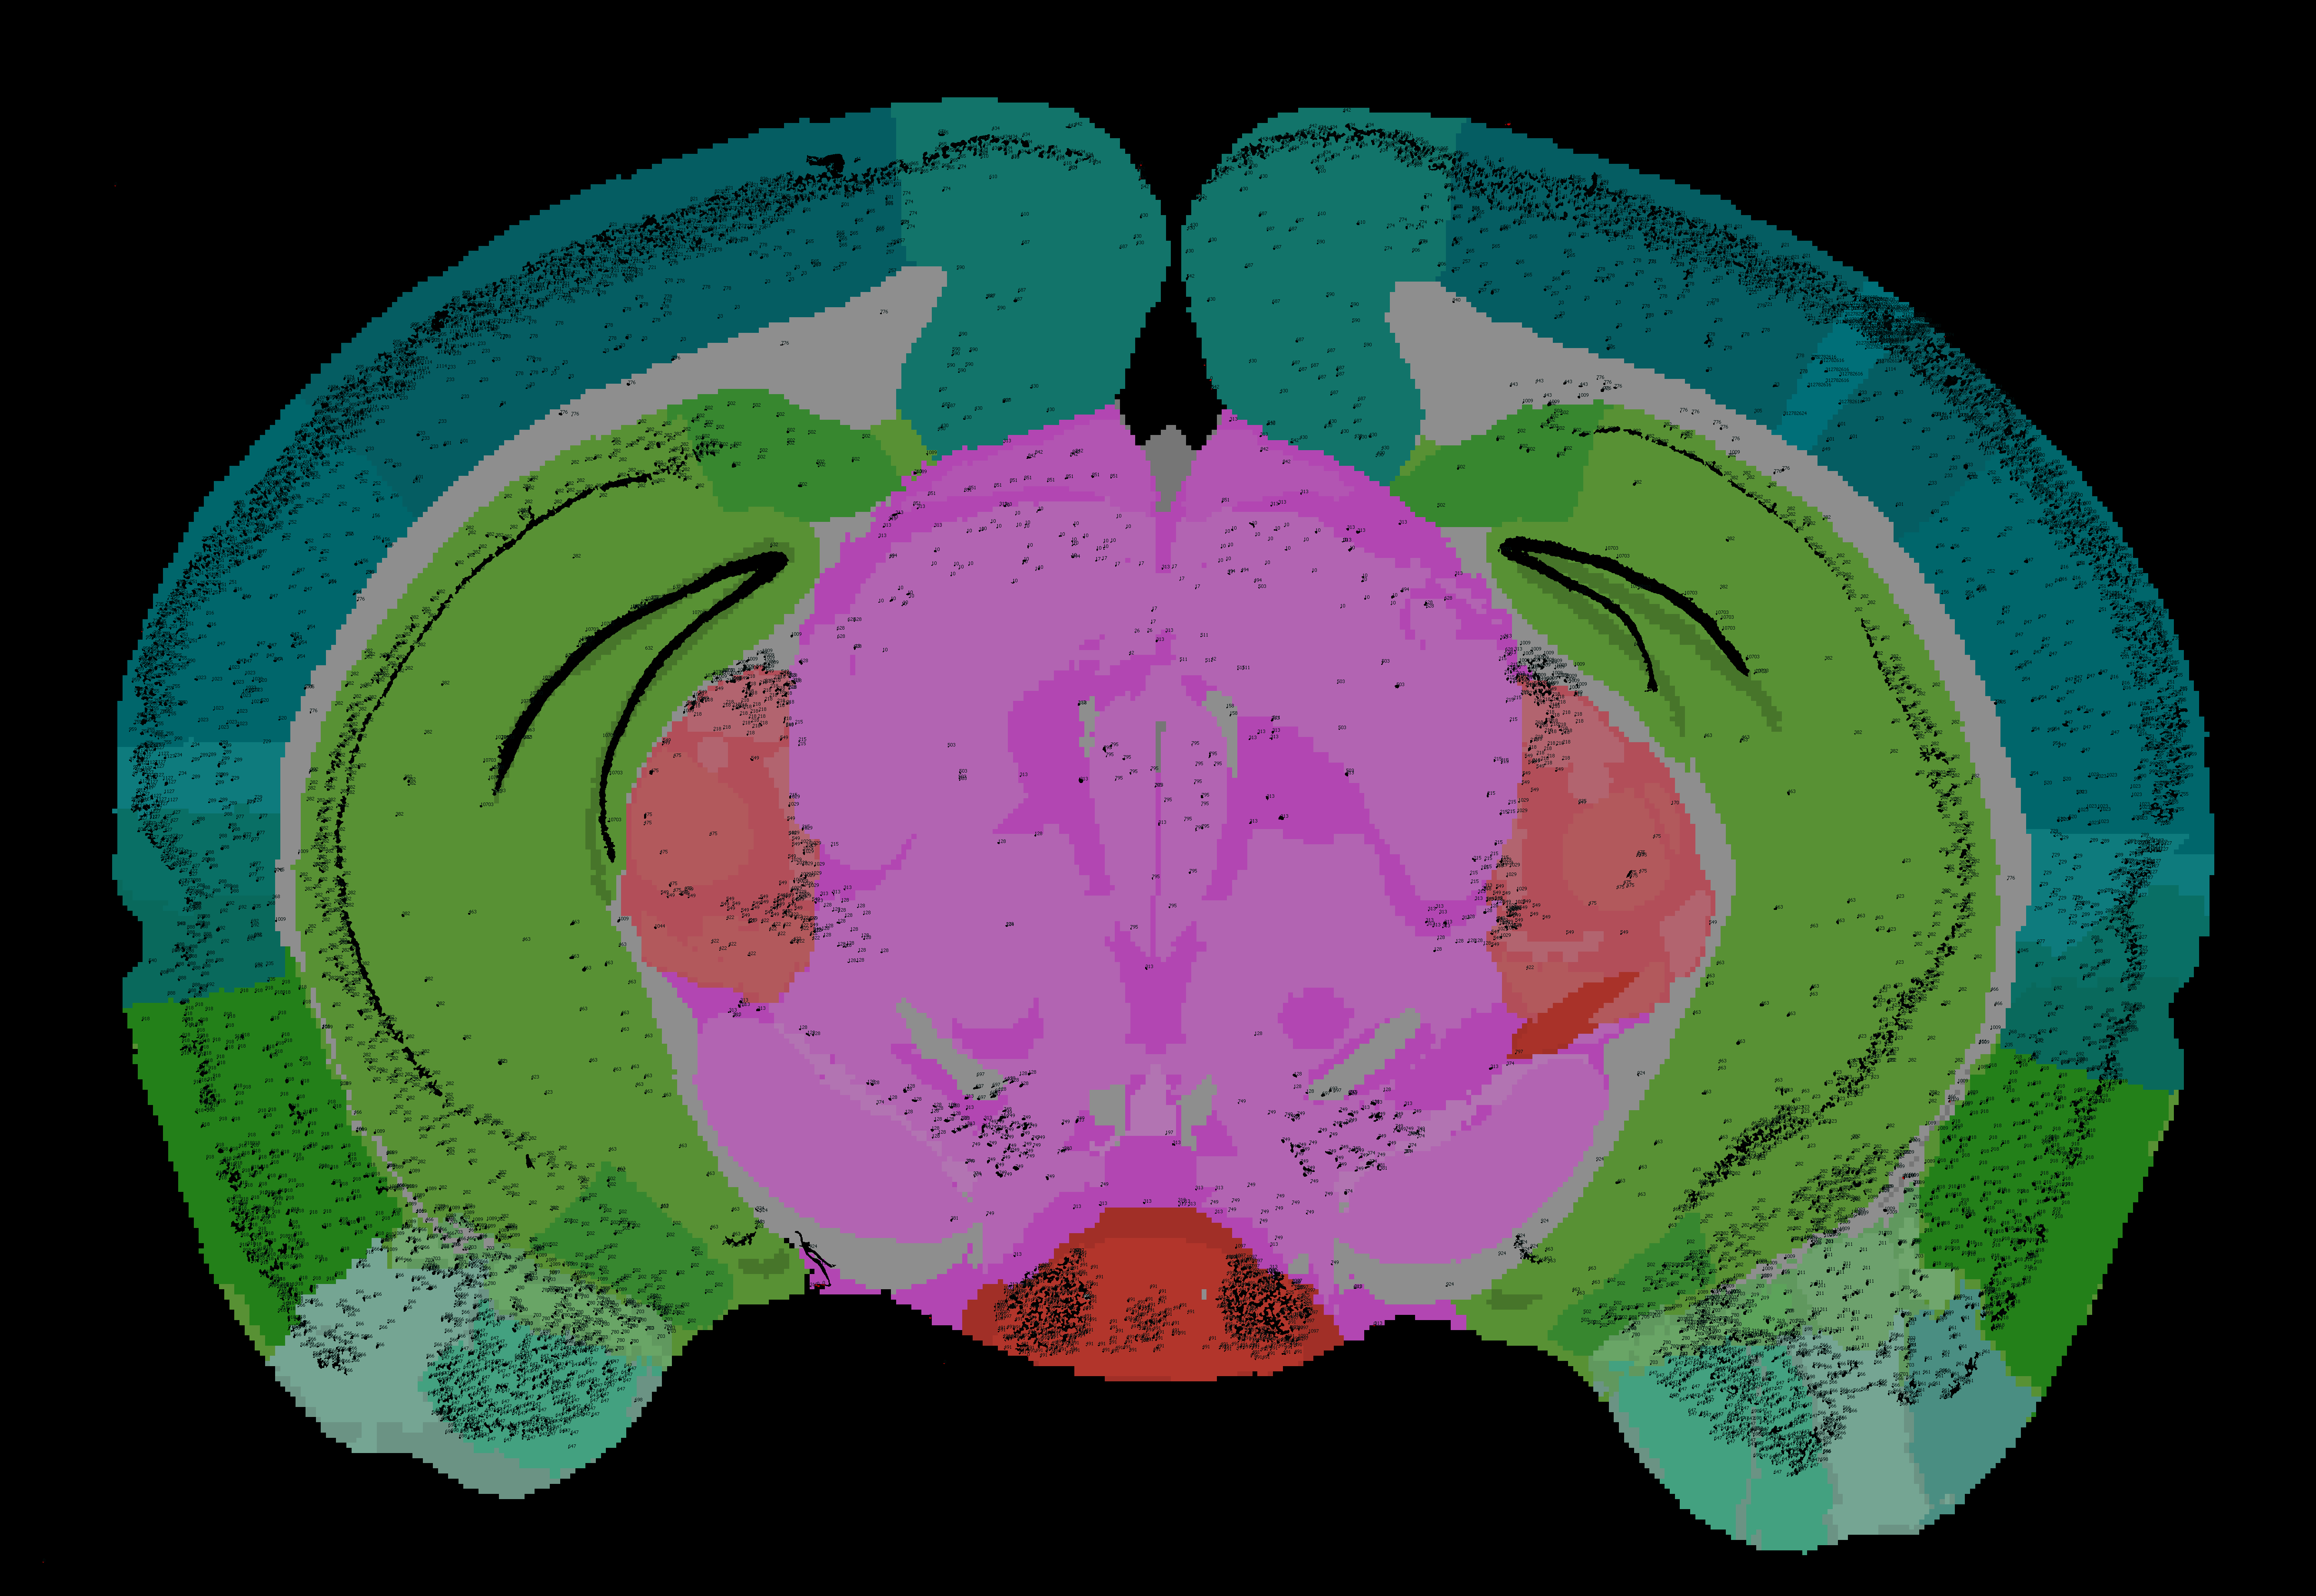
- Images in PNG format
Segmentations superimposed on the atlas maps. Object colours are assigned based on the sheet specified under “Report Regions”. If custom areas and colours are not specified, or object falls outside of the specified areas, the objects are shown in red by default.
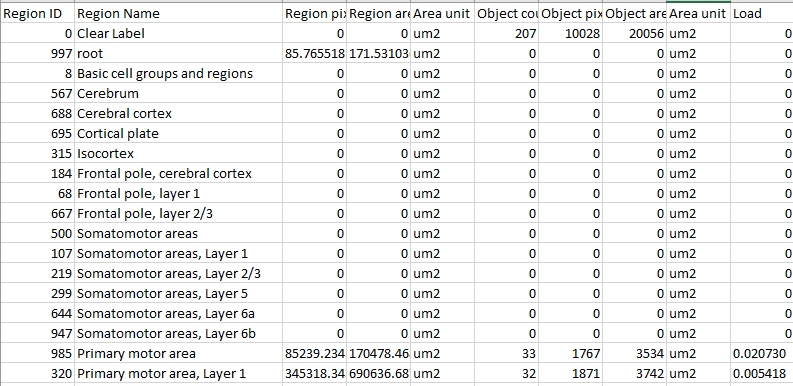
- Reports in CSV format
-RefAtlasRegions: report with output organised based on all the regions in the reference atlas.
-CustomRegionsSummary and CustomRegionSections: reports with the output organised based on the custom regions defined in the template for the whole series (Summary) and for each individual section.
-Objects: list of all the objects in the whole series (Whole Brain), with sheets showing breakdown per section.
- Coordinates in JSON format (for the whole series and per section)
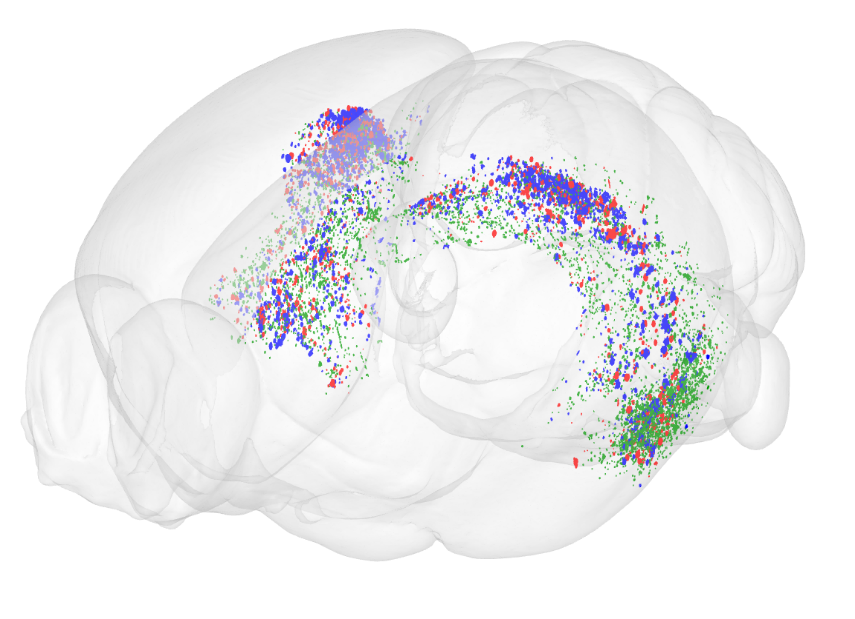
Visualise the QUINT output
The JSON files contains the point clouds that can be visualised with the MeshView atlas viewer, which is available at www.nitrc.org/projects/meshview via the MediaWiki link.