Widget PSE
Widget PSE
Source code: https://github.com/the-virtual-brain/tvb-widgets
Purpose
It is composed of two separate Jupyter Widgets(PSE Launcher and PSE Visualizer) intended for the visualization of launching custom simulations. The launcher works locally for now, but in the future a HPC launch will be available.
The simulation can be customized by:
- Getting a list of connectivities given as API
- Setting up parameters and ranges
- Selecting multiple metrics
Inputs
- PSELauncher(Simulator, List_of_Connectivities)
- PSEVisualizer(Filename), the file will contain all the customized parameters from the launcher
Requirements and installation
Before installing the tvb-widgets library containing the PSE widgets, the following python library and Jupyter extensions should be installed:
- Libraries
- Extensions
jupyter labextension install @jupyter-widgets/jupyterlab-manager
jupyter labextension install jupyter-matplotlib
Then, to install the tvb-widgets library, just type:
pip install tvb-widgets
API usage
First, the correct matplotlib backend must be set, which enables the interaction with the PSE widgets, by running the following command:
%matplotlib widget
Then, the PSELauncher and PSEWidget(from the tvb-widgets API) and the package lab(from tvb simulator) should be imported:
from tvbwidgets.api import PSELauncher, PSEWidget
from tvb.simulator.lab import *
The launcher widget can be initialized with the required parameters (simulator and the list of connectivities) as it shows below:
sim = simulator.Simulator(connectivity = connectivity.Connectivity.from_file())
conn_66 = connectivity.Connectivity.from_file("connectivity_66.zip")
conn_68 = connectivity.Connectivity.from_file("connectivity_68.zip")
conn_76 = connectivity.Connectivity.from_file()
launch = PSELauncher(sim, [conn_66, conn_68, conn_76])
The outcome will be something like in the image bellow.
You can create a customized simulation by choosing different values for parameters, by setting ranges for them and by selecting the metrics for the simulation.
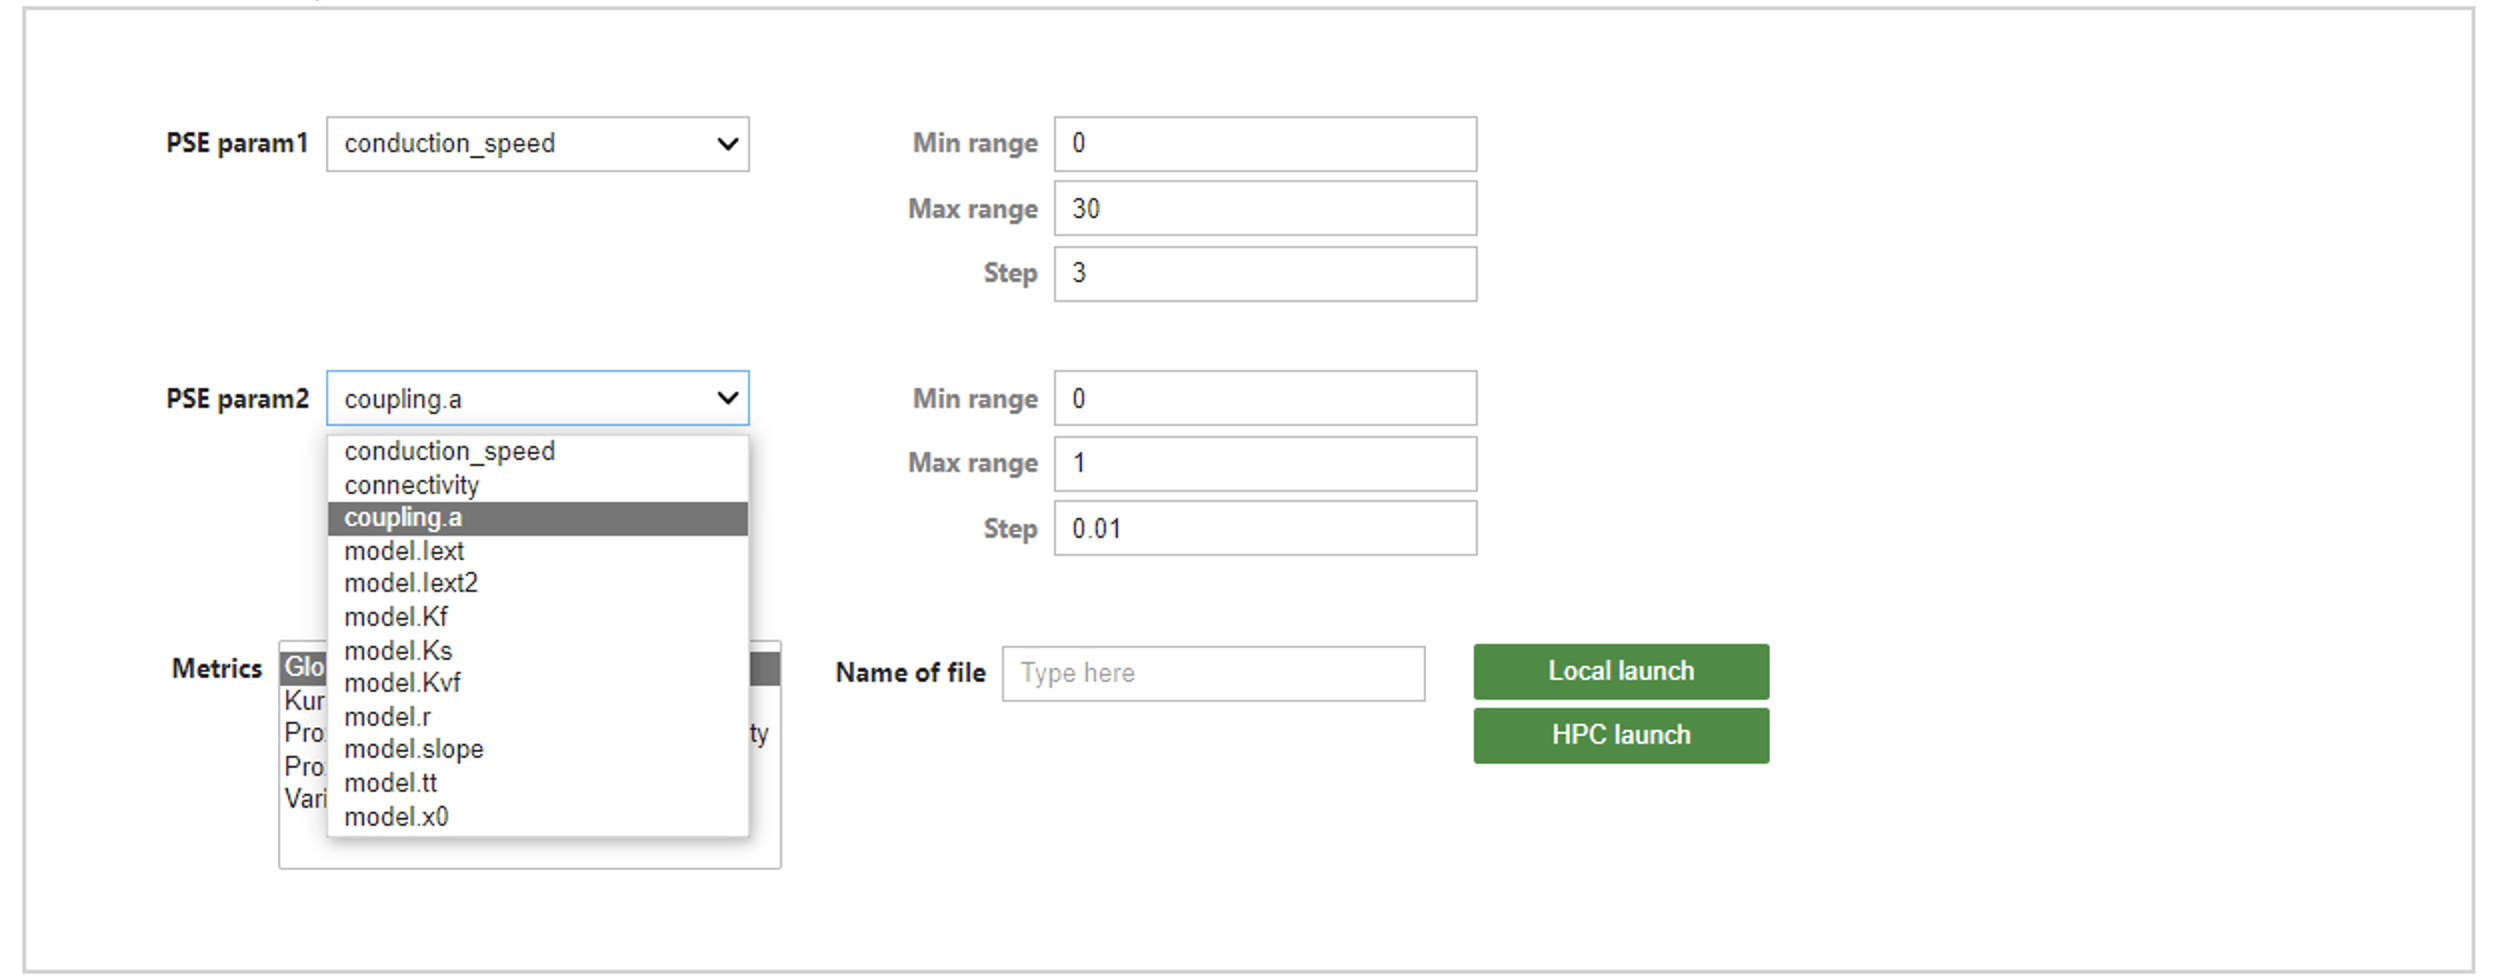
Then, a file name has to be inserted in the indicated box(for storing the data) and as a last set-up, a launch type has to be chosen.
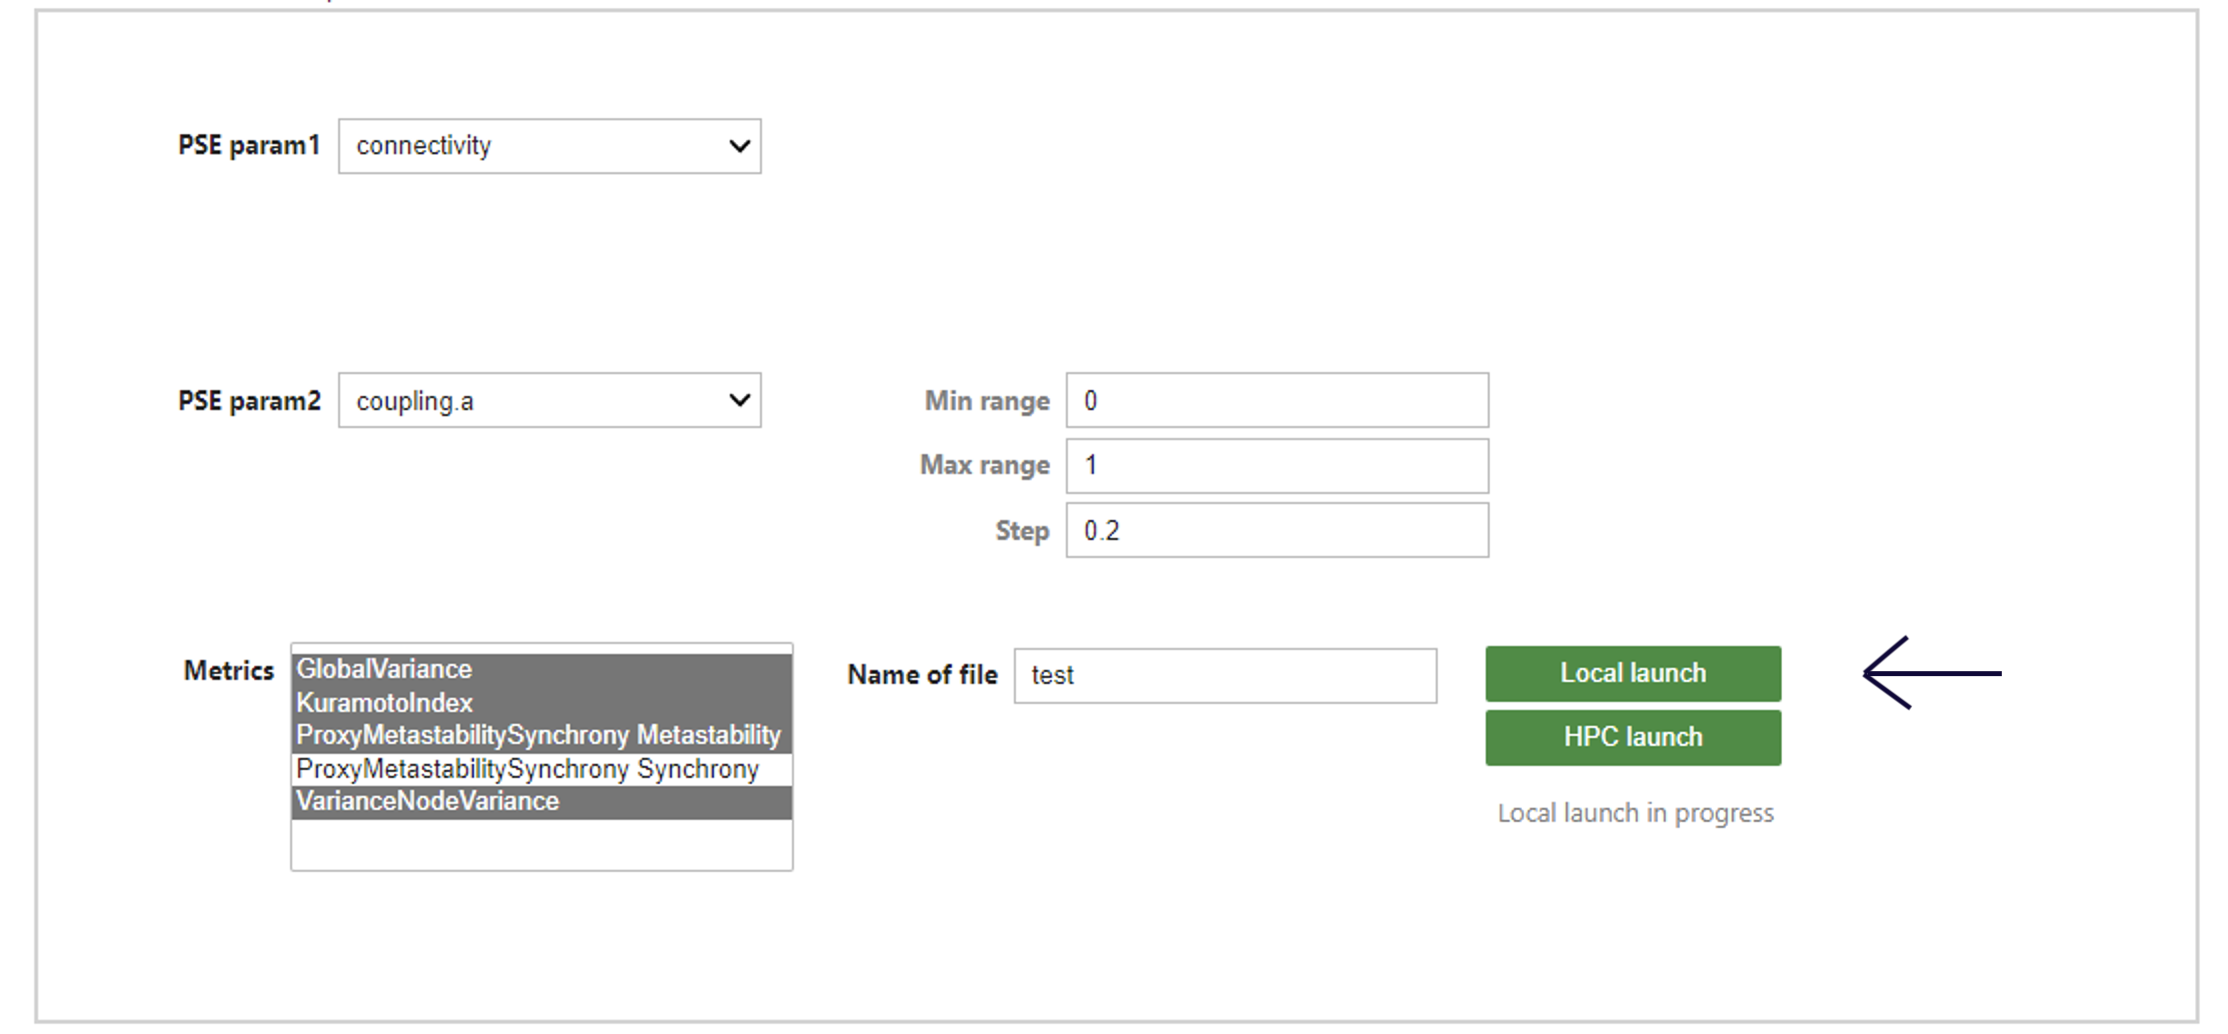
A file with the name you specified will be generated.
Then, the PSEVisualizer can be called with the required parameter(file_name) as it shows below:
pse = PSEWidget("test.h5")
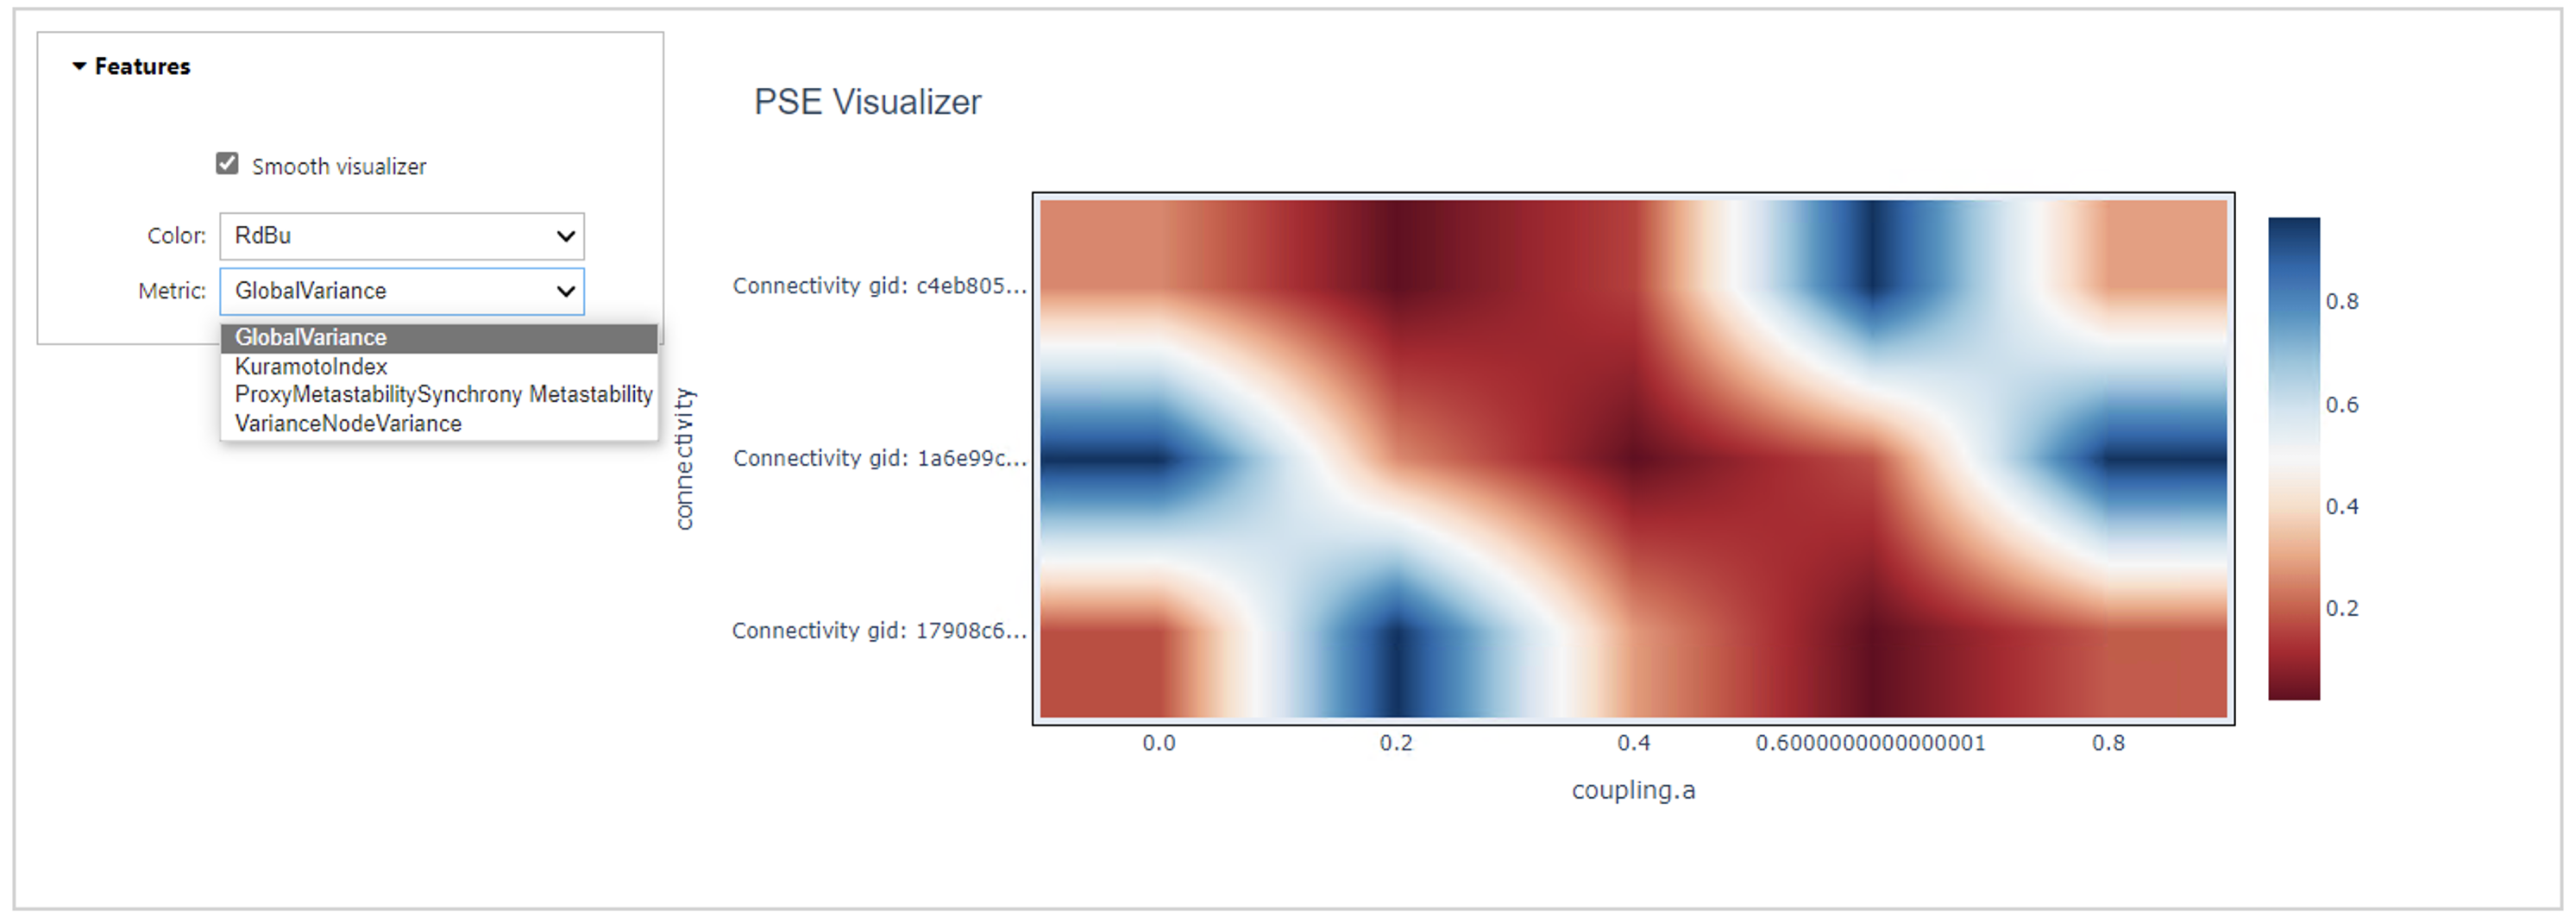
The outcome will be something like in the image bellow.
There will be a representation for every metric that was chosen before, in the launcher. The widget has some features for the type of visualization, the change of color and the option for choosing between metrics.