Advanced prototype software integrating heterogeneous region models
SGA3 D1.2 - Showcase 1: "Degeneracy in neuroscience - when is Big Data big enough"
The Showcase is implemented as a series of interactive Jupyter notebooks covering the individual logical steps and can be accessed in a dedicated public EBRAINS collab.
The EBRAINS collab consists of interlinked Drive, Bucket, Wiki, and Lab. The Drive provides small file storage and contains the notebooks and all supporting code. The Bucket is a large file storage service and holds the pre-computed results of the extensive parameter sweeps and model optimizations to allow skipping the computationally demanding steps. The documentation of the showcase implementation is collected in the Wiki. The Lab service is an instance of JupyterLab—an interactive computing environment where the notebooks can be run and worked with.
The notebooks in this collab will load all required Python modules including Siibra and The Virtual Brain, and the interfaces for launching the computationally demanding parts in the HPC infrastructure. Running the notebooks requires an EBRANS account with permissions to access the Lab and the Knowledge Graph API. In addition, to be able to interact with the HPC infrastructure, the user has to have access to an active allocation on the corresponding FENIX site.
Simulation of resting state
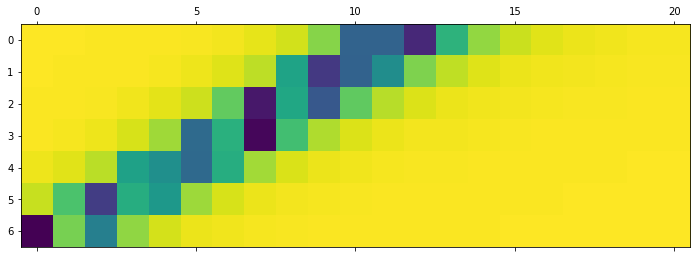
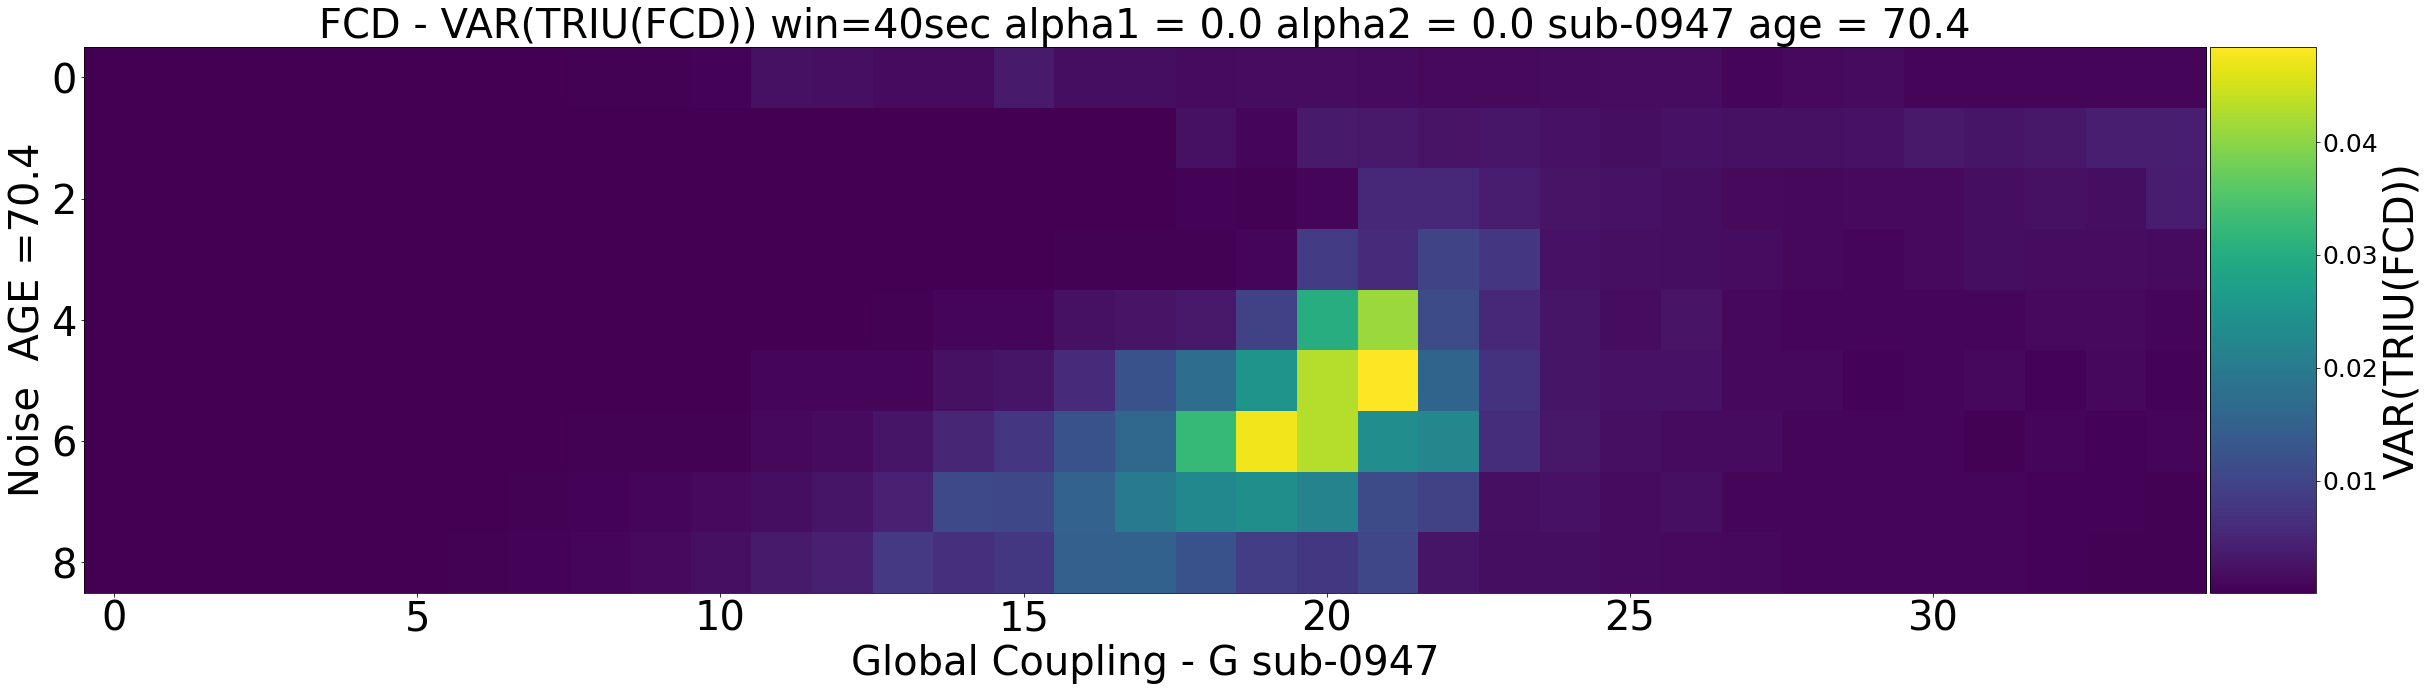
The fist notebook in the inter-individual variability workflow explores the resting-state simulation for a subject of the 1000BRAINS dataset. Functional data are simulated by means of a brain network model implemented in TVB, which is an ensemble of neural mass models linked via the weights of the structural connectivity (SC) matrix. Following topics are covered:
- The neural mass model by Montbrio, Pazo and Roxin
- Construction of the TVB model for a particular subject
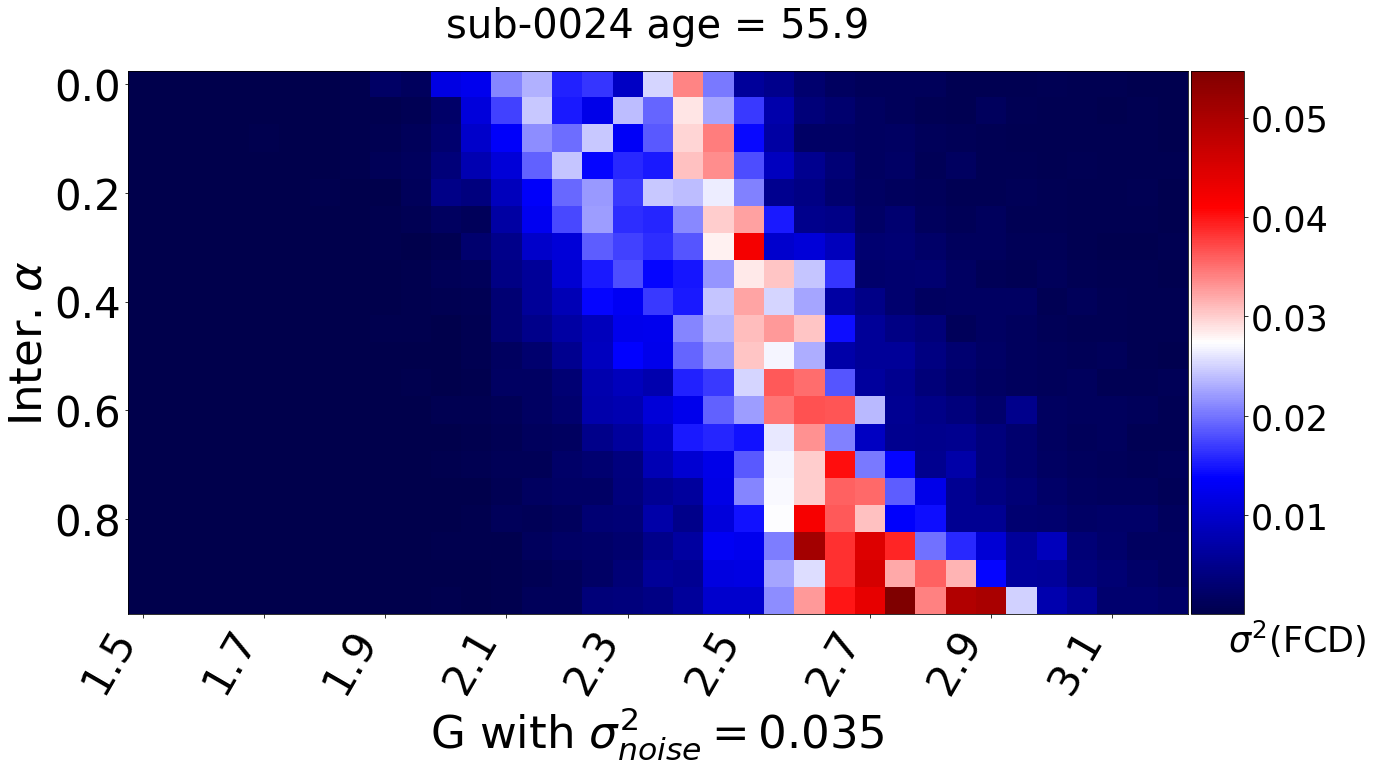
- Dynamics of the model, and execution of a parameter study
- Summary of the simulation results for the whole cohort
Link to the notebook:
Virtual ageing trajectories
The second steps shows the investigation of virtual ageing trajectory for each subject. In this context, we are going to show
- What we mean by virtual ageing and what is the empirical basis to investigate this approach
- How we can virtually age a subject using whole-brain modelling
- How the increase structure-function relationship relates to virtual ageing
Link to the notebook:
Inference with SBI
Last step of the inter-individual variability workflow employs Simulation Based Inference for estimation of the full posterior values of the parameters. Here, a deep neural estimator is trained to provide a relationship between the parameters of a model (black box simulator) and selected descriptive statistics of the observed data.

Link to the notebook:
Regional variability data
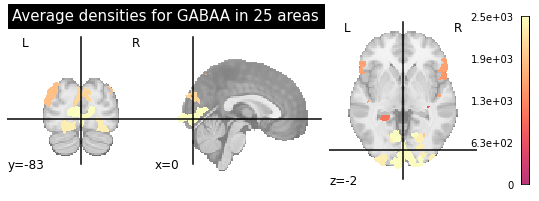
The first step of the regional variability workflow loads the data from the Knowledge Graph and defines the regional bias on the model. In this case we require: 1) structural connectivity matrices, 2) GABA and AMPA receptor densities at each region, and 3) empirical resting-state fMRI data for fitting and validation of the simulations. The three datasets shall be characterised in the same parcellation.
Link to the notebook:
Fitting model parameters for models with regional bias
A series of simulations of the whole-brain network model is launched in the EBRAINS HPC facilities in order to identify the optimal model parameters leading to simulated resting-state brain activity that best resembles the empirically observed activity.
Link to the notebook: